
A Moving Average (MA) is a widely used indicator in technical analysis, designed to smooth out price data by creating a constantly updated average price. This calculation aims to reduce the impact of short-term fluctuations in asset prices over a specified period. There are two main types of moving averages: Simple Moving Averages (SMAs), which use an arithmetic mean of prices over a given timeframe, and Exponential Moving Averages (EMAs), which give more weight to recent prices within the period.
Moving averages are commonly used in Prop Trading for trading analysis and improving results.
How Moving Averages Work
Moving averages serve several purposes in financial analysis, including identifying trend direction and determining support and resistance levels. As a trend-following or lagging indicator, MAs rely on historical price data. The length of the moving average period directly affects its lag; for instance, a 200-day moving average lags more than a 20-day moving average because it covers a longer timeframe. The 50-day and 200-day moving averages are particularly popular among traders and investors.
Traders select different period lengths for moving averages based on their specific trading goals. Shorter MAs are typically used for short-term trading strategies, while longer-term MAs are favored by investors with longer time horizons. While predicting future price movements is inherently uncertain, using technical analysis and conducting thorough research can improve predictive accuracy. Generally, a rising moving average indicates an uptrend, while a declining moving average suggests a downtrend.
Types of Moving Averages
Simple Moving Average (SMA)
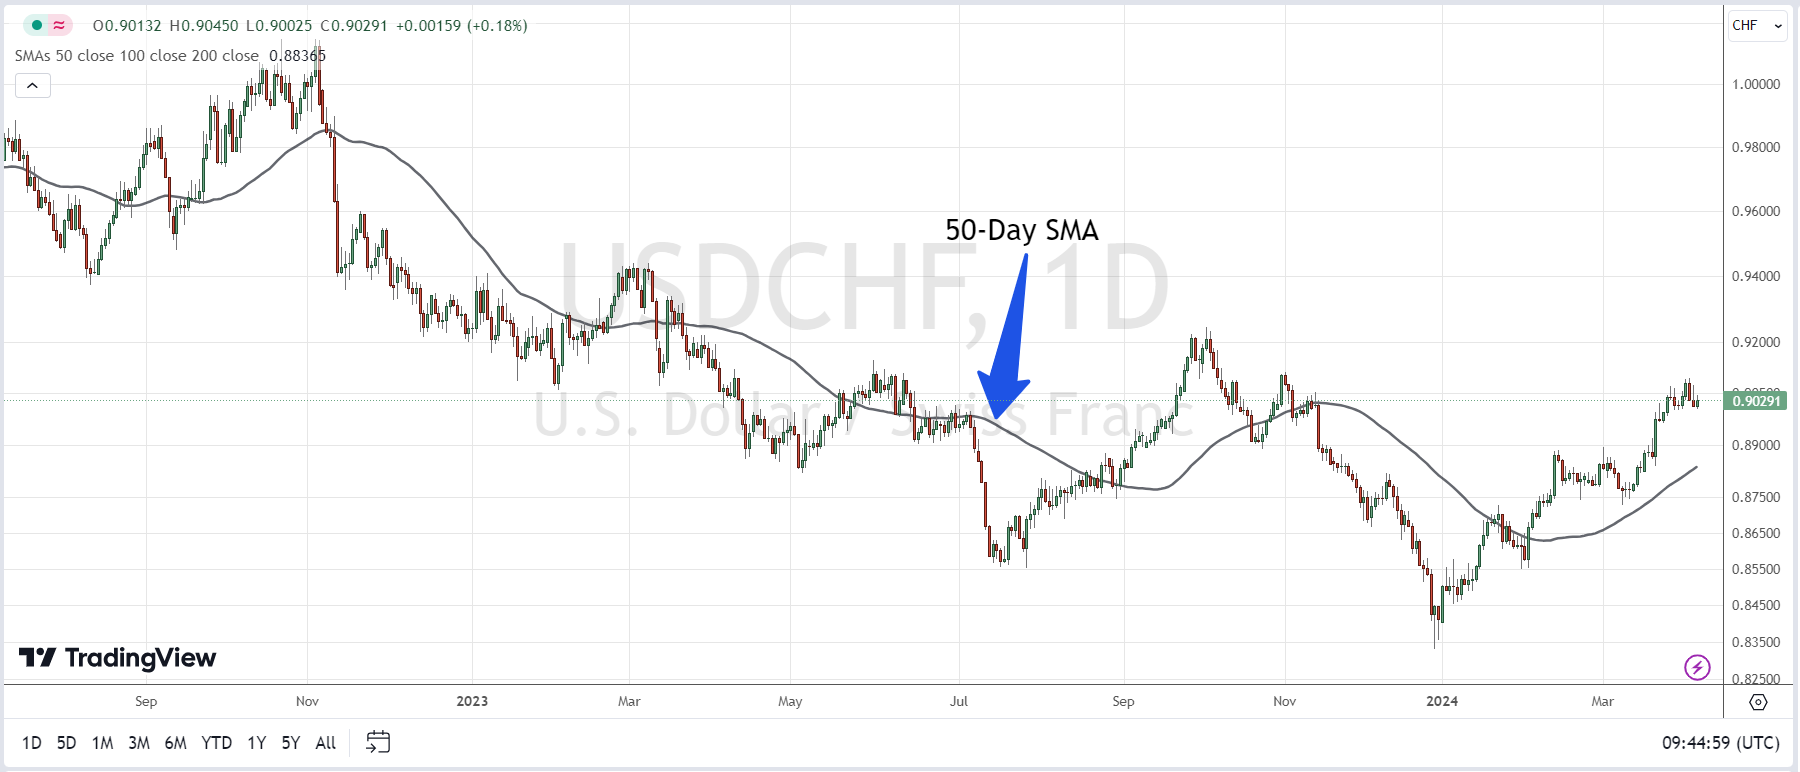
A Simple Moving Average (SMA) is calculated by taking the arithmetic mean of a set of values over a specific period. This involves summing a series of numbers, such as stock prices, and dividing by the number of values in the set. When charting prices using an SMA, the result is a line that smooths out fluctuations, providing a clearer view of the overall trend.
Exponential Moving Average (EMA)
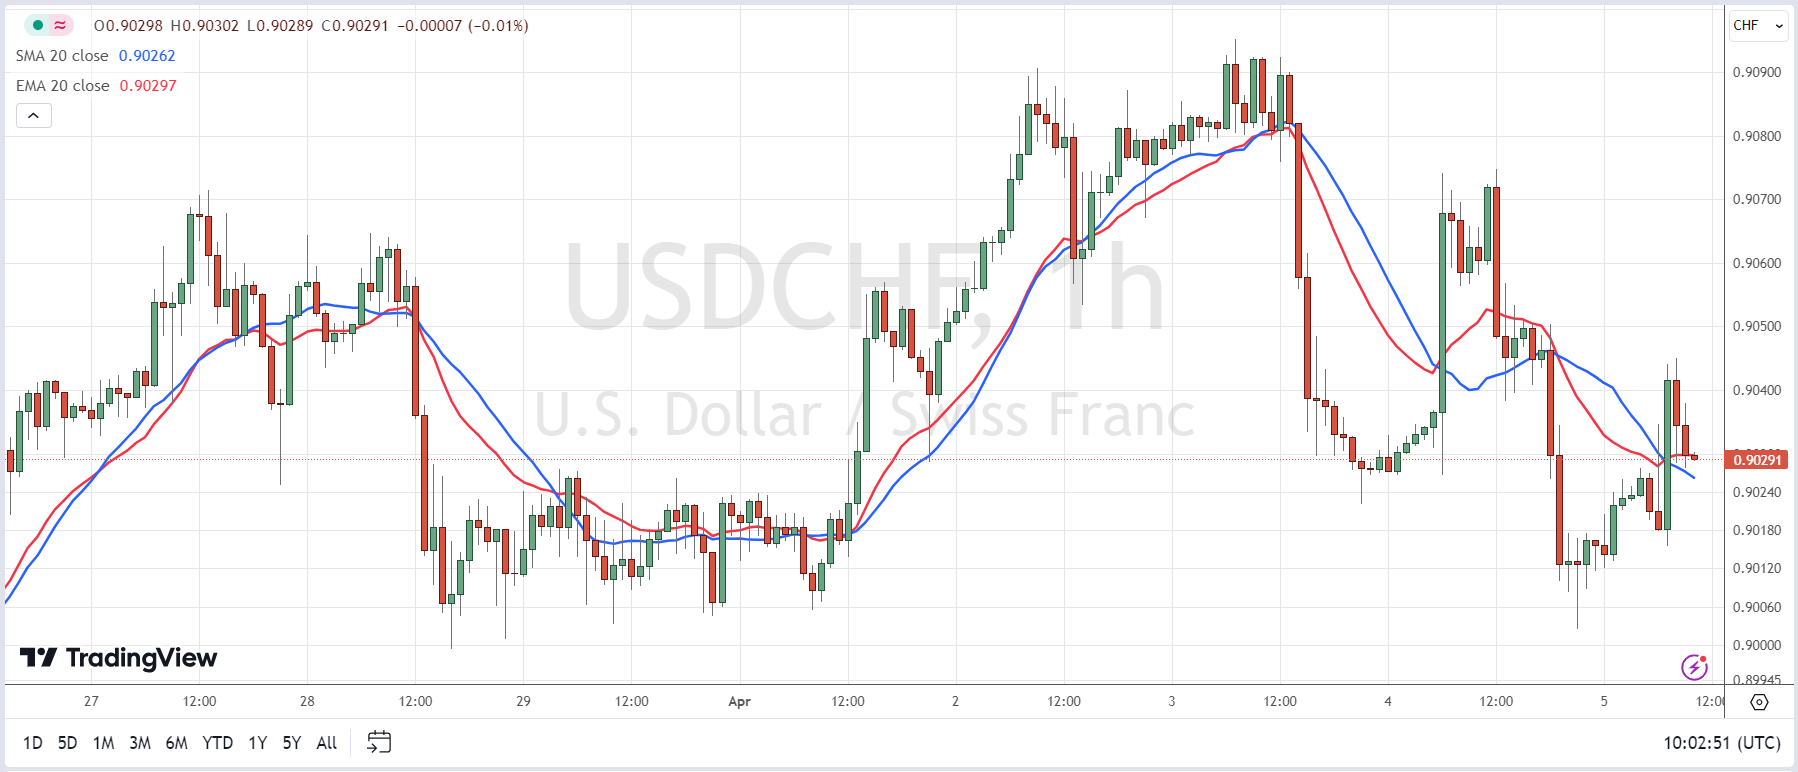
An Exponential Moving Average (EMA) gives more weight to recent prices, making it more responsive to new information. The EMA calculation starts with the SMA over a specific period, then applies a multiplier for weighting the EMA, known as the “smoothing factor.” This factor is calculated as [2 / (selected time period + 1)]. For a 20-day moving average, the multiplier would be [2 / (20 + 1)] = 0.0952. This factor is then used with the previous EMA value to compute the current EMA, which reacts more quickly to price changes compared to the SMA. When prices rise, the EMA tends to be higher than the SMA, and it falls more rapidly when prices decline.
Moving Average Convergence Divergence (MACD)
MACD is a tool used to evaluate the relationship between two moving averages. It is calculated by subtracting a 26-day EMA from a 12-day EMA. MACD also includes a signal line, which is a 9-day EMA plotted on the same graph as the MACD line. This signal line helps identify crossovers and trend shifts. A positive MACD value indicates that the short-term average is above the long-term average, suggesting upward momentum, while a negative value indicates downward momentum.
The Golden Cross Pattern
A golden cross is a chart pattern where a short-term moving average crosses above a long-term moving average, typically signaling a bullish breakout. For example, when a 15-day moving average surpasses a 50-day moving average, it indicates a potential bull market ahead. This signal is often considered more reliable when accompanied by high trading volumes.
EMA and Dynamic Support and Resistance
90% of traders who use moving averages use one or more of these five periods:
- 10
- 20
- 50
- 100
- 200
As a result, they have come to expect a market reaction once these lines are reached. Often, when these 90% of traders use the MAs and expect a market reaction, EMAs can act as dynamic support and resistance levels. Even though it is not guaranteed, we can observe the following case of a 10-day EMA plotted on a EUR/USD chart:
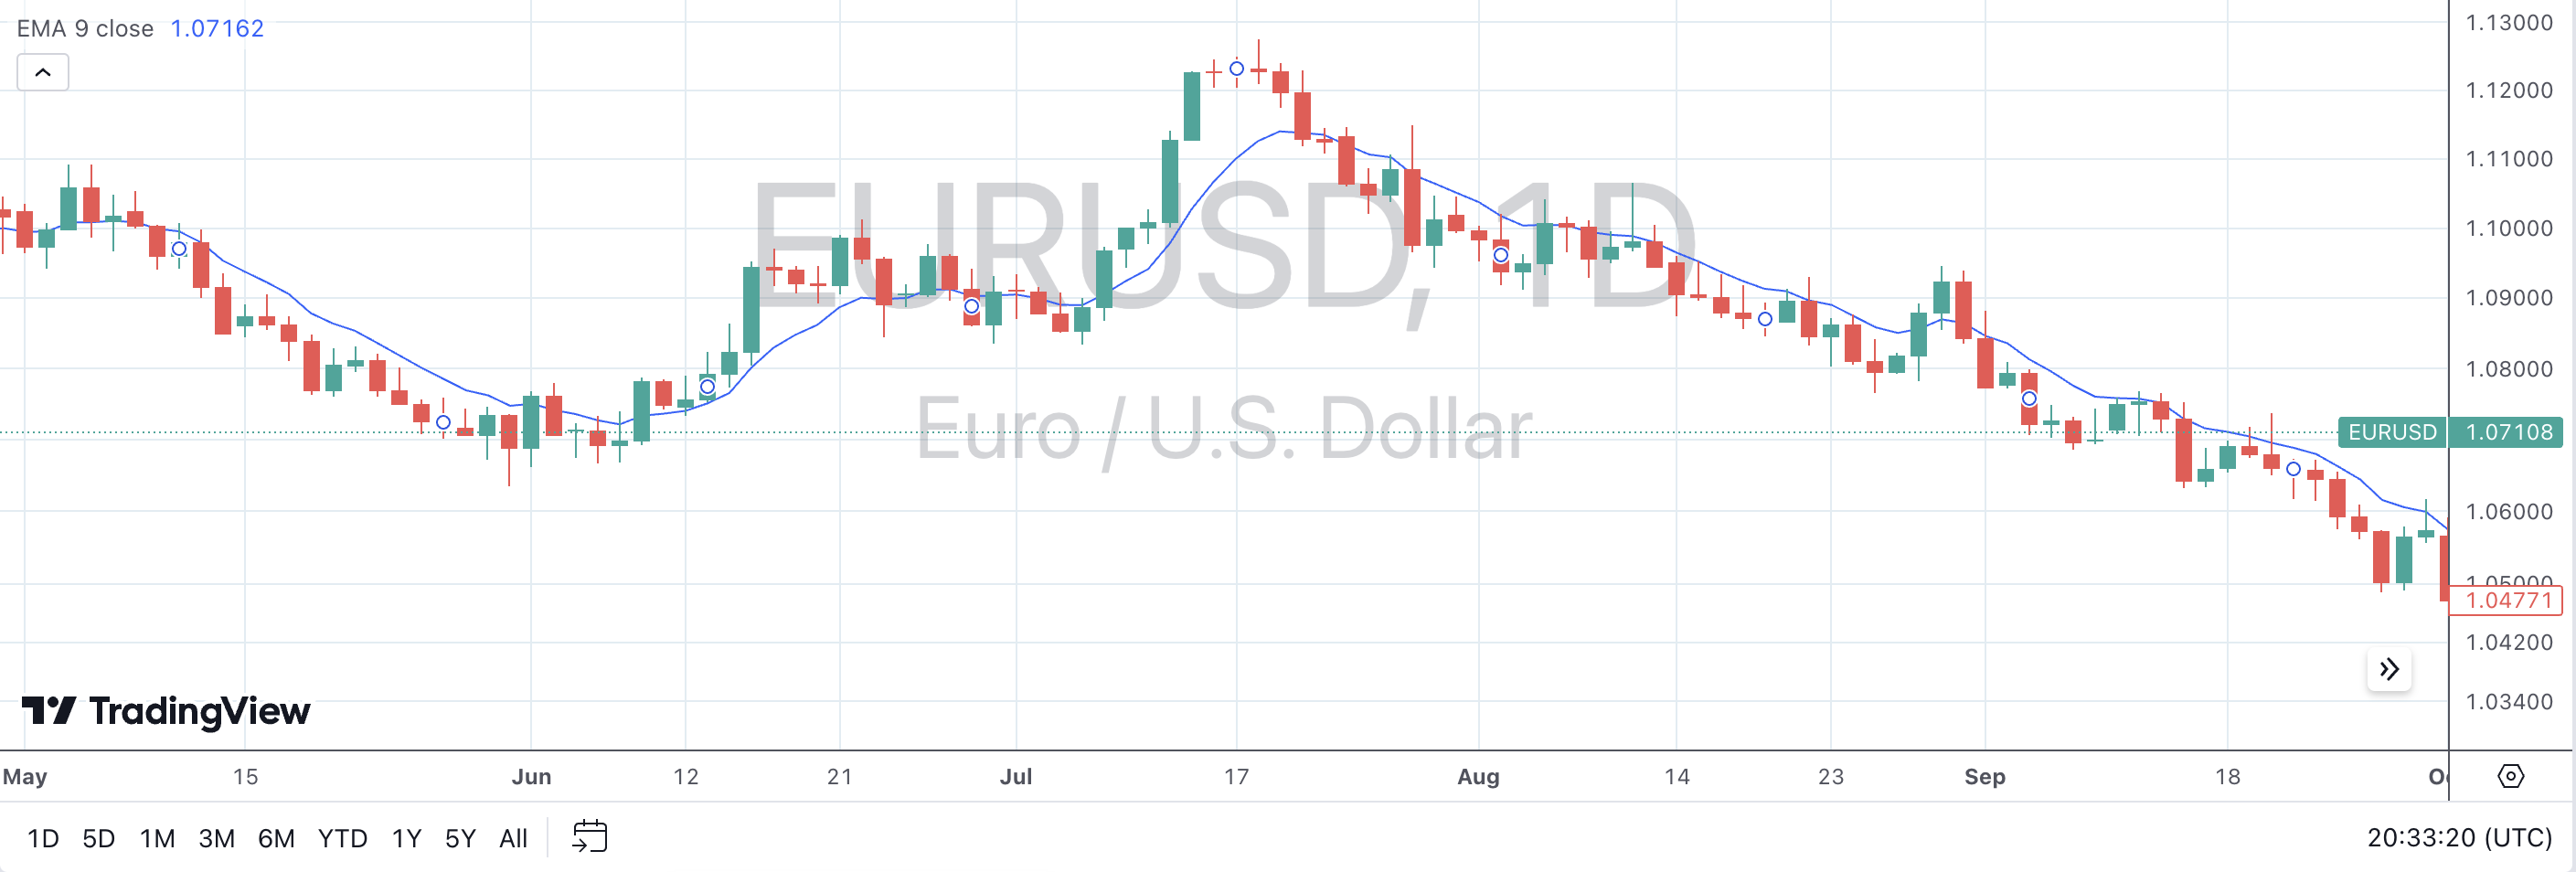
As we can see, the 10 EMA resistance level held quite well for most of the downtrend. Almost every time the price came close to the 10 EMA and tested it, it acted as resistance, and the price bounced back down. Of course, the price will not always immediately bounce off an MA set up as dynamic support or resistance. Sometimes, it will go a little further before returning to the direction of the larger trend. In other cases, the price goes right through such levels altogether.
Conclusion
Moving averages are essential tools in technical analysis, used to smooth out price data and identify trends. A rising moving average suggests an uptrend, while a declining one indicates a downtrend. The EMA is generally preferred over the SMA due to its responsiveness to recent price changes, providing clearer insights into new information and trends.
For further reading you can visit our FPT Trading Academy.