A trend represents the general direction in which market prices move, determined by their historical trajectory of peaks (high points) and troughs (low points). The overall movement of these points, whether ascending, descending, or sideways, defines the market’s trend direction. Many traders prefer to trade in the direction of the prevailing market trend, whereas contrarians seek to capitalize on potential reversals by trading against the trend. Successful prop trading hinges on accurate timing, which distinguishes profitable trades from those that diminish account equity.
Trend Directions
An uptrend is marked by a general upward movement in price, characterized by fluctuations where recent low points are higher than previous lows and the same applies to high points. This upward trajectory must persist for the trend to be classified as an uptrend.
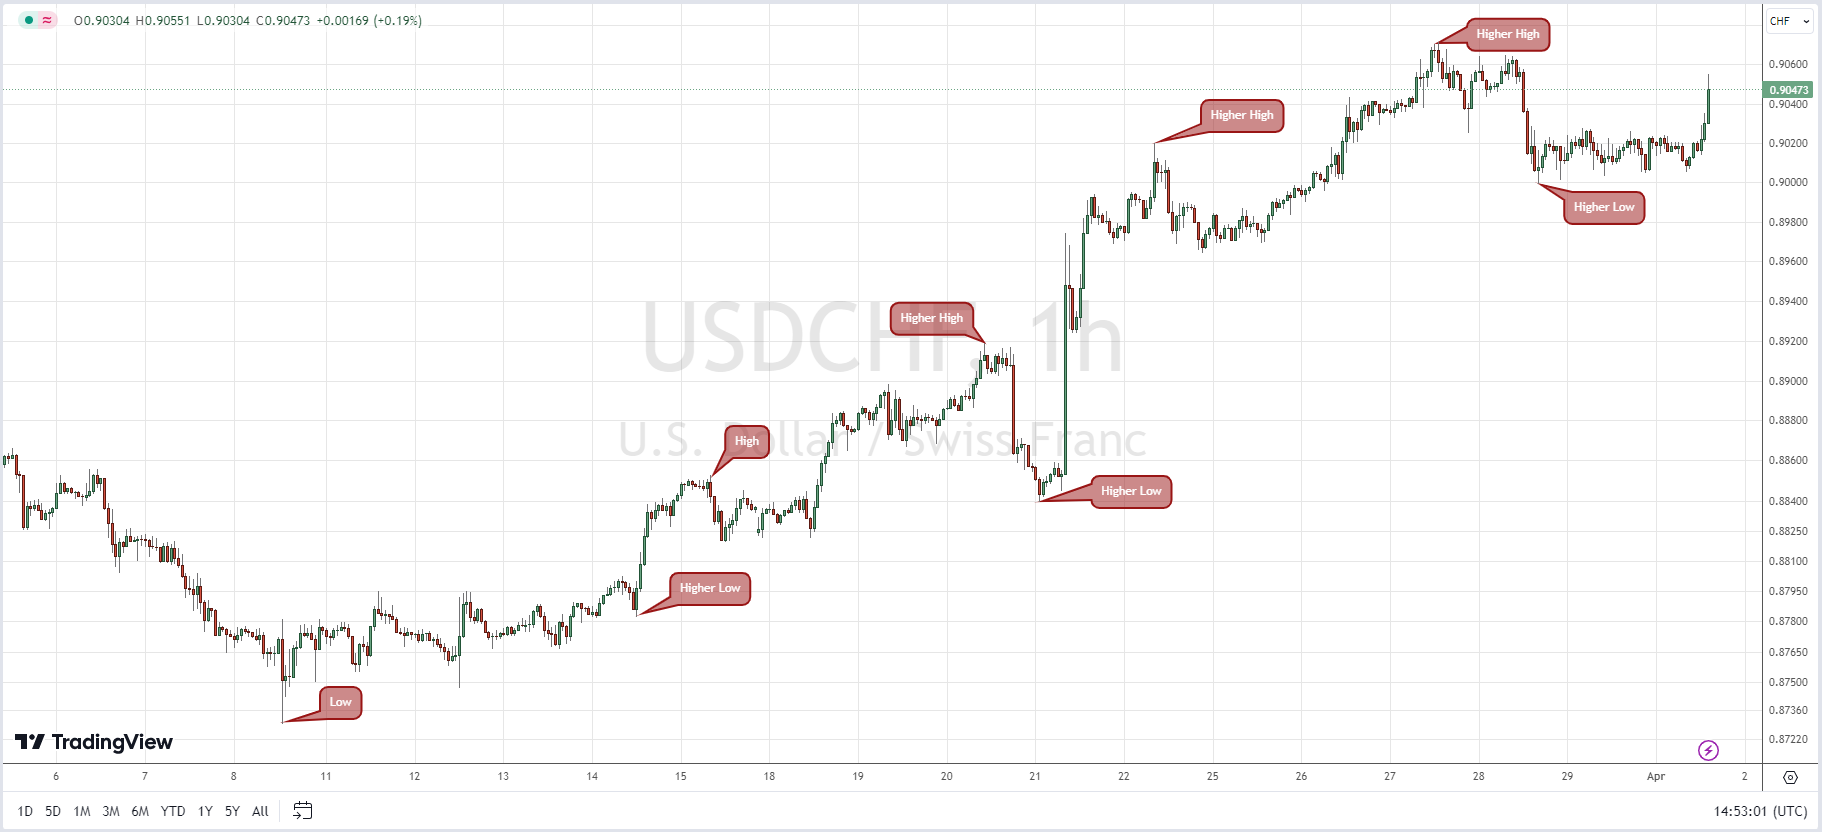
When the pattern weakens, it signals that the uptrend might be losing momentum or transitioning into a downtrend. During an uptrend, traders focus on buying opportunities, expecting the price to continue rising until indicators suggest otherwise. These indicators could include the formation of lower swing lows or highs, price breaking below a trendline, or technical indicators turning bearish.
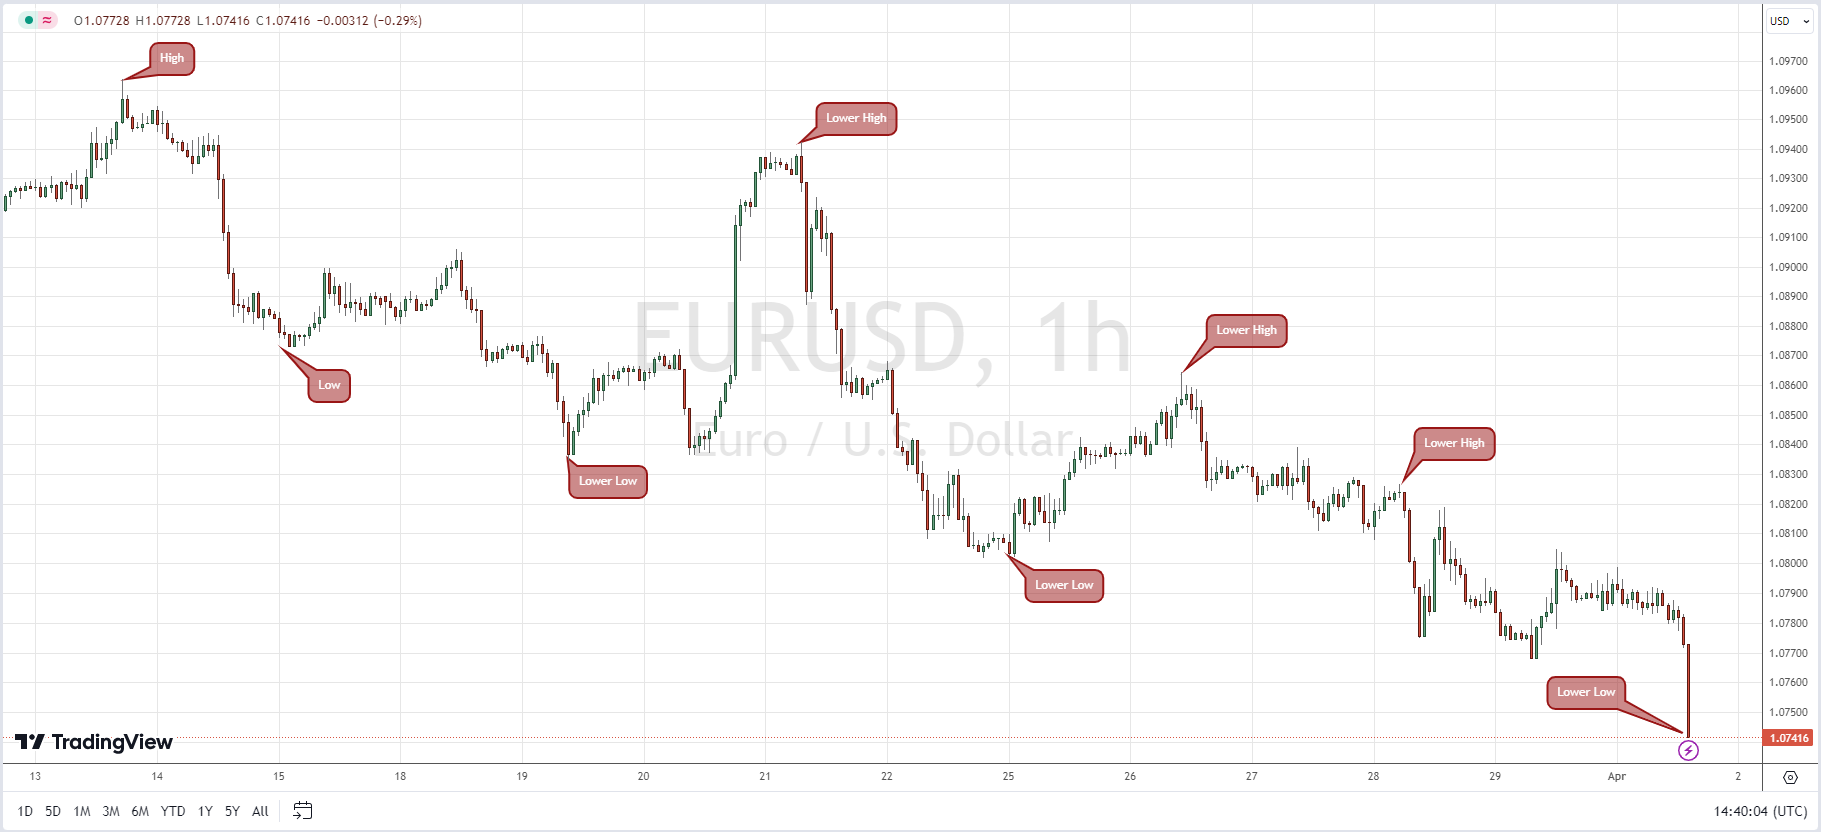
Conversely, downtrends are identified by lower troughs and peaks, where the price generally moves downward. The principles that apply to uptrends are mirrored in downtrends but in the opposite direction. In a downtrend, a winning strategy would involve using upward corrections as opportunities to sell short, anticipating continued price depreciation.
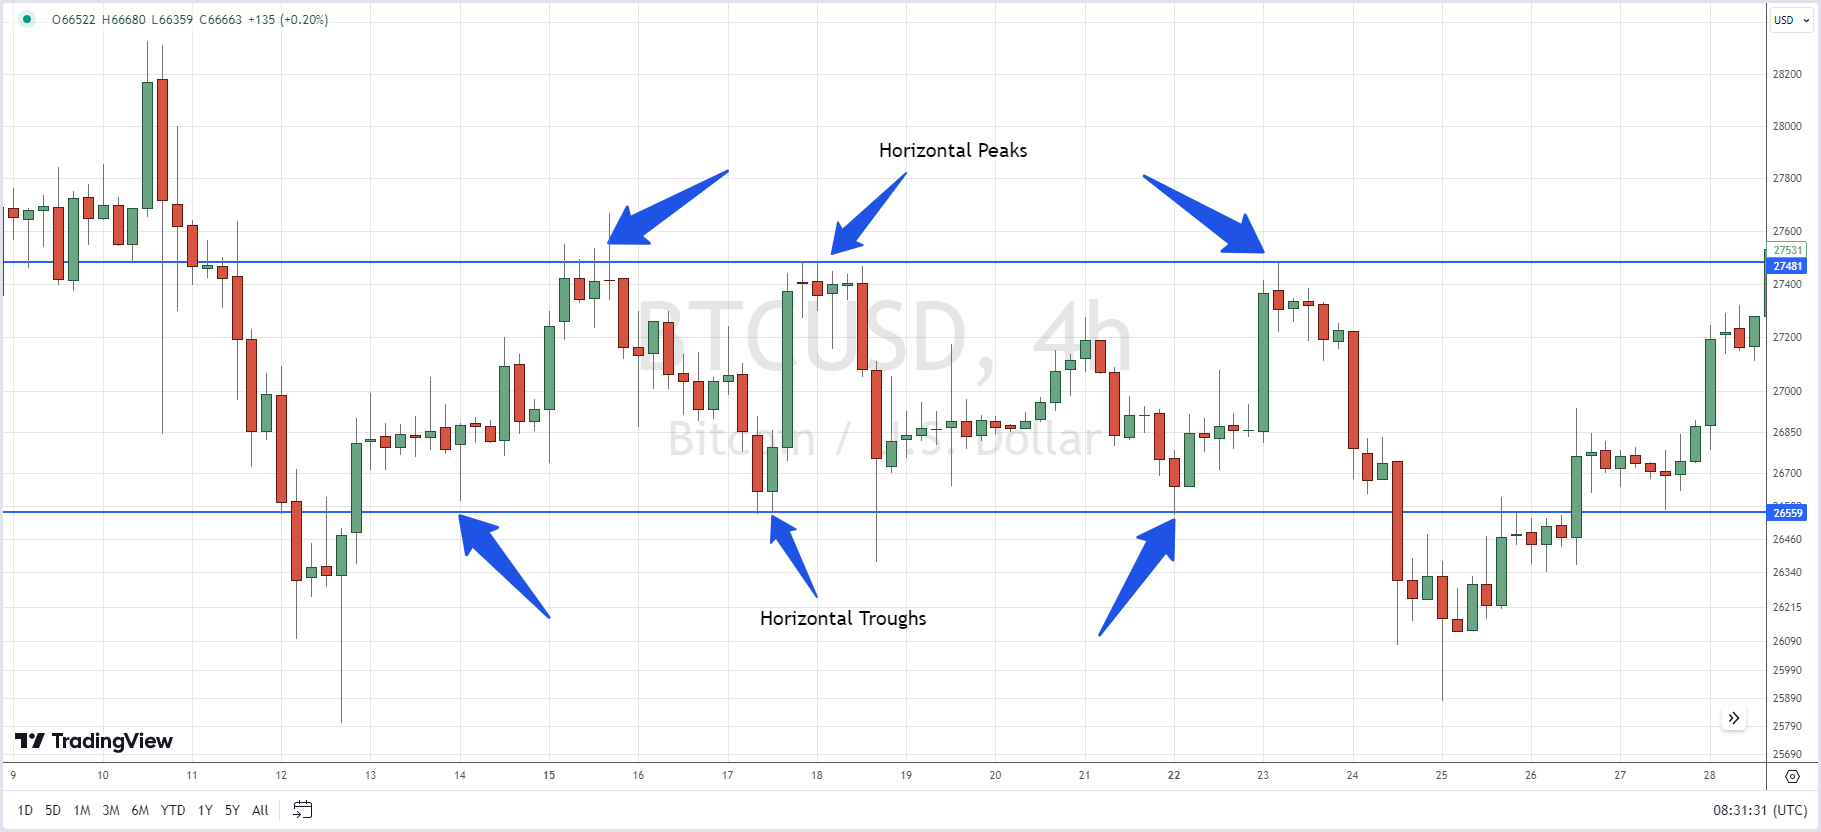
Markets sometimes experience periods of consolidation, where they are neither in an uptrend nor a downtrend. This sideways movement, or range, can last from a few minutes to several years and is characterized by trading bound between horizontal peaks and troughs, making it easily identifiable on a chart.
Trend Lengths and Dow Theory
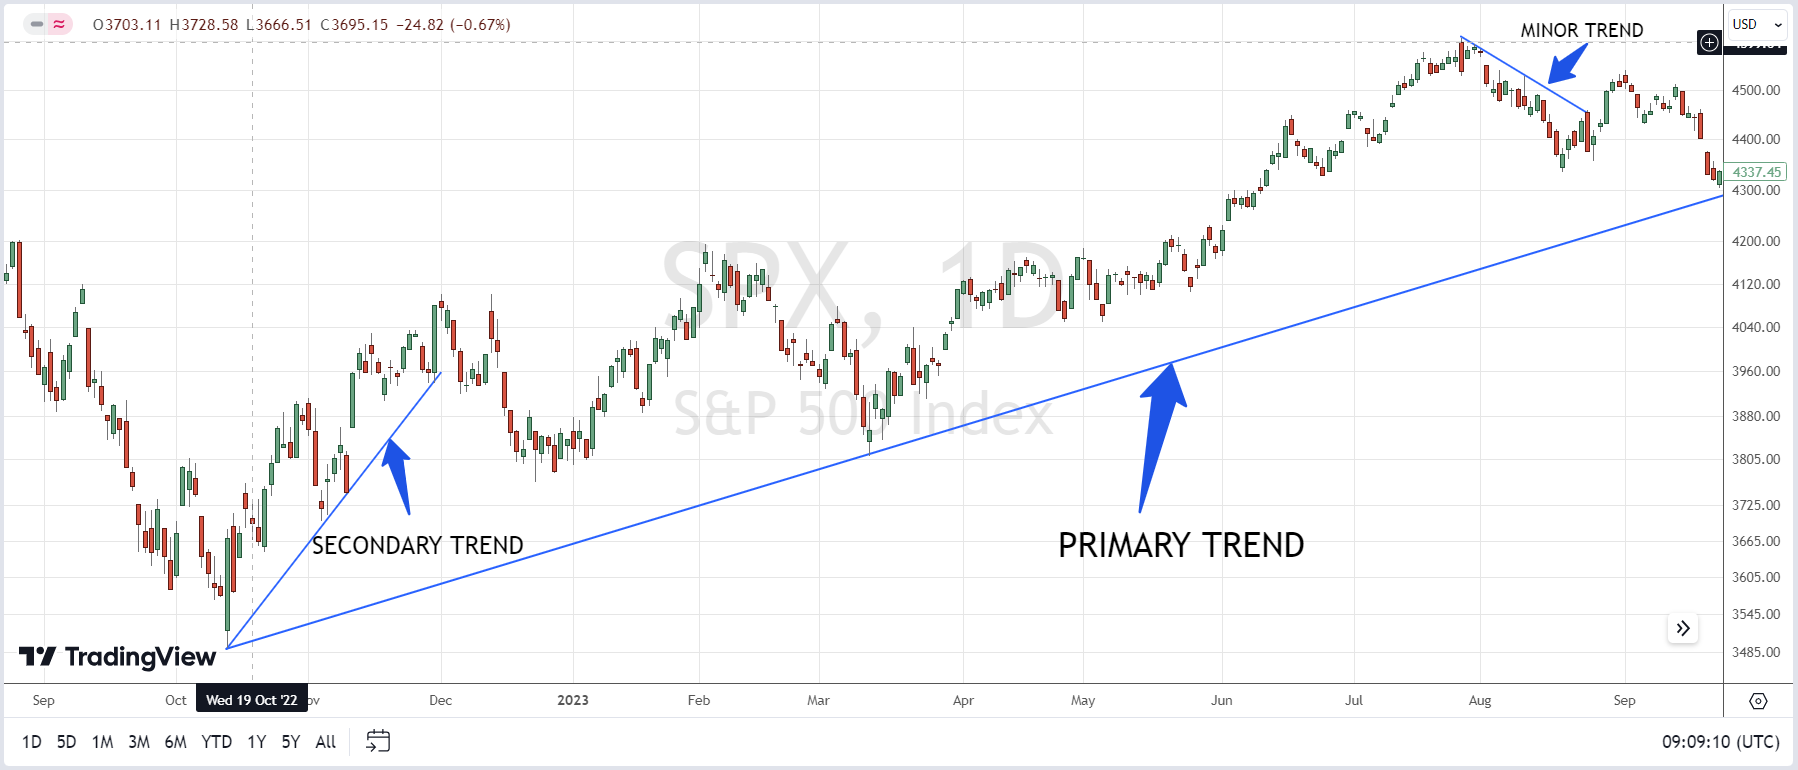
Charles Dow, a pioneer in technical analysis, formulated principles known as Dow Theory to understand and dissect market dynamics. Dow likened instruments’ price movements to waves in the ocean, where trends are akin to rising and receding tides. He identified three lengths of trends:
- Primary Trend – This is the dominant, long-term movement lasting a year or more, similar to the overarching tide in Dow’s analogy;
- Secondary Trend – This intermediate movement lasts from one to three months, comparable to the waves in Dow’s theory;
- Minor Trend – These are short-term fluctuations lasting less than a month, resembling smaller ripples in Dow’s analogy.
Trends are influenced by adjacent longer and shorter trends. A rising long-term trend results in larger rallies and smaller retracements in the intermediate trend, while the short-term trend causes fluctuations within the intermediate trend. Conversely, a declining long-term trend leads to smaller rallies and larger retracements in the intermediate trend, with the short-term trend contributing to its oscillations.
Trend Lines in Technical Analysis
Traders often use trend lines to identify and confirm market trends. A trend line is a straight line connecting two or more price points and extending into the future, serving as a support or resistance line. Many principles relevant to support and resistance levels apply to trend lines.
An uptrend line connects two or more low points, moving upward and to the right. The second low must be higher than the first, indicating an upward trajectory.
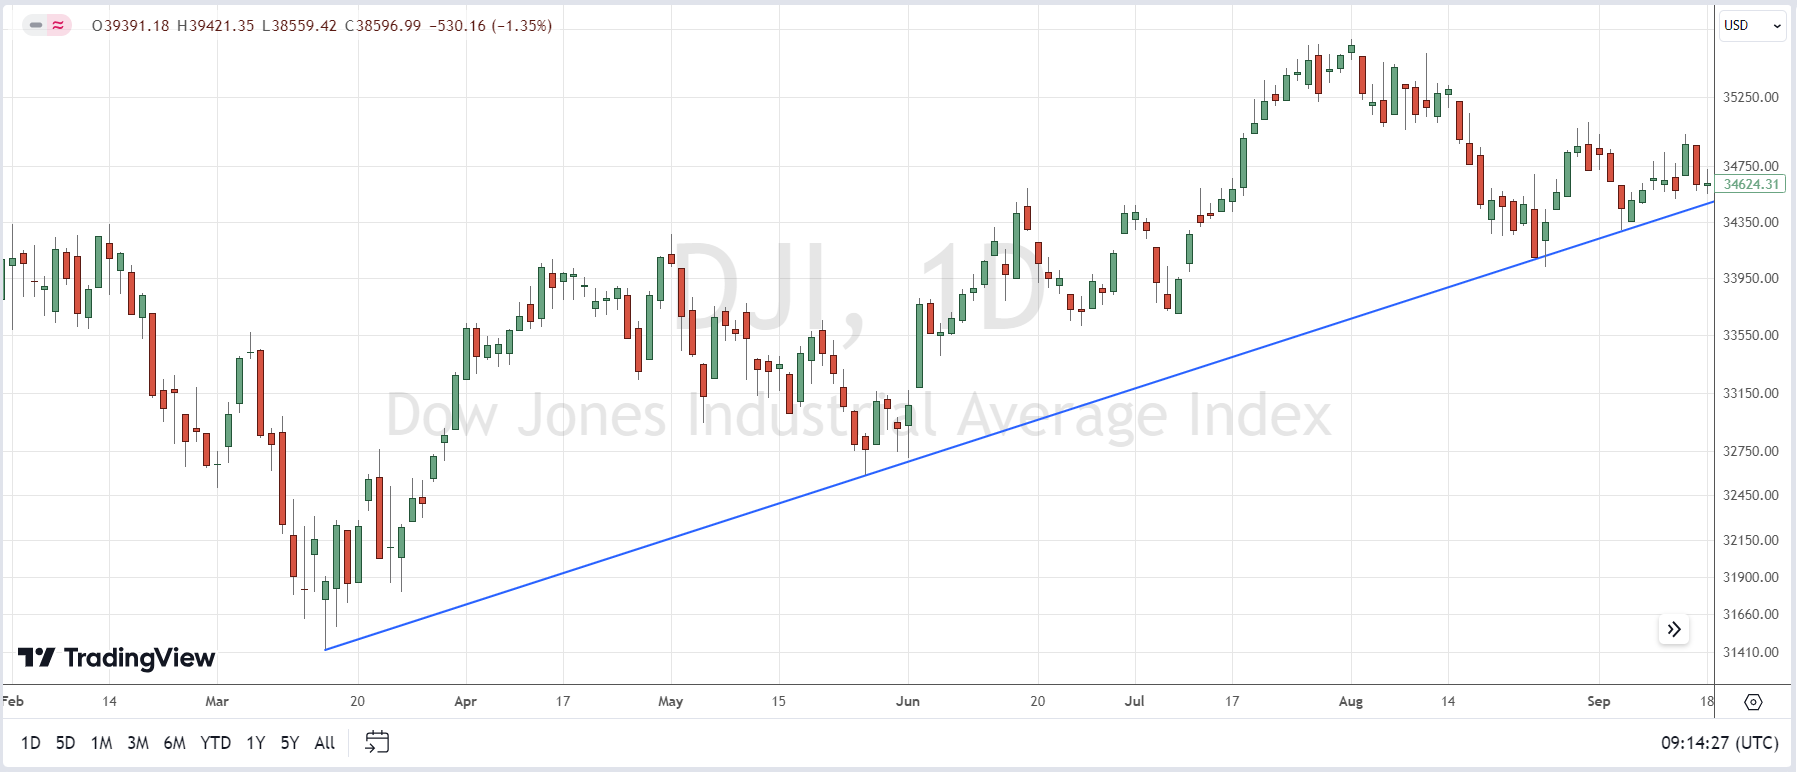
Uptrend lines act as support levels, suggesting greater demand than supply, even as prices increase. As long as prices stay above the trend line, the uptrend is considered intact. A breach below the uptrend line signals a potential trend reversal.
A downtrend line connects two or more high points, moving downward and to the right. The second high must be lower than the first, indicating a downward slope.
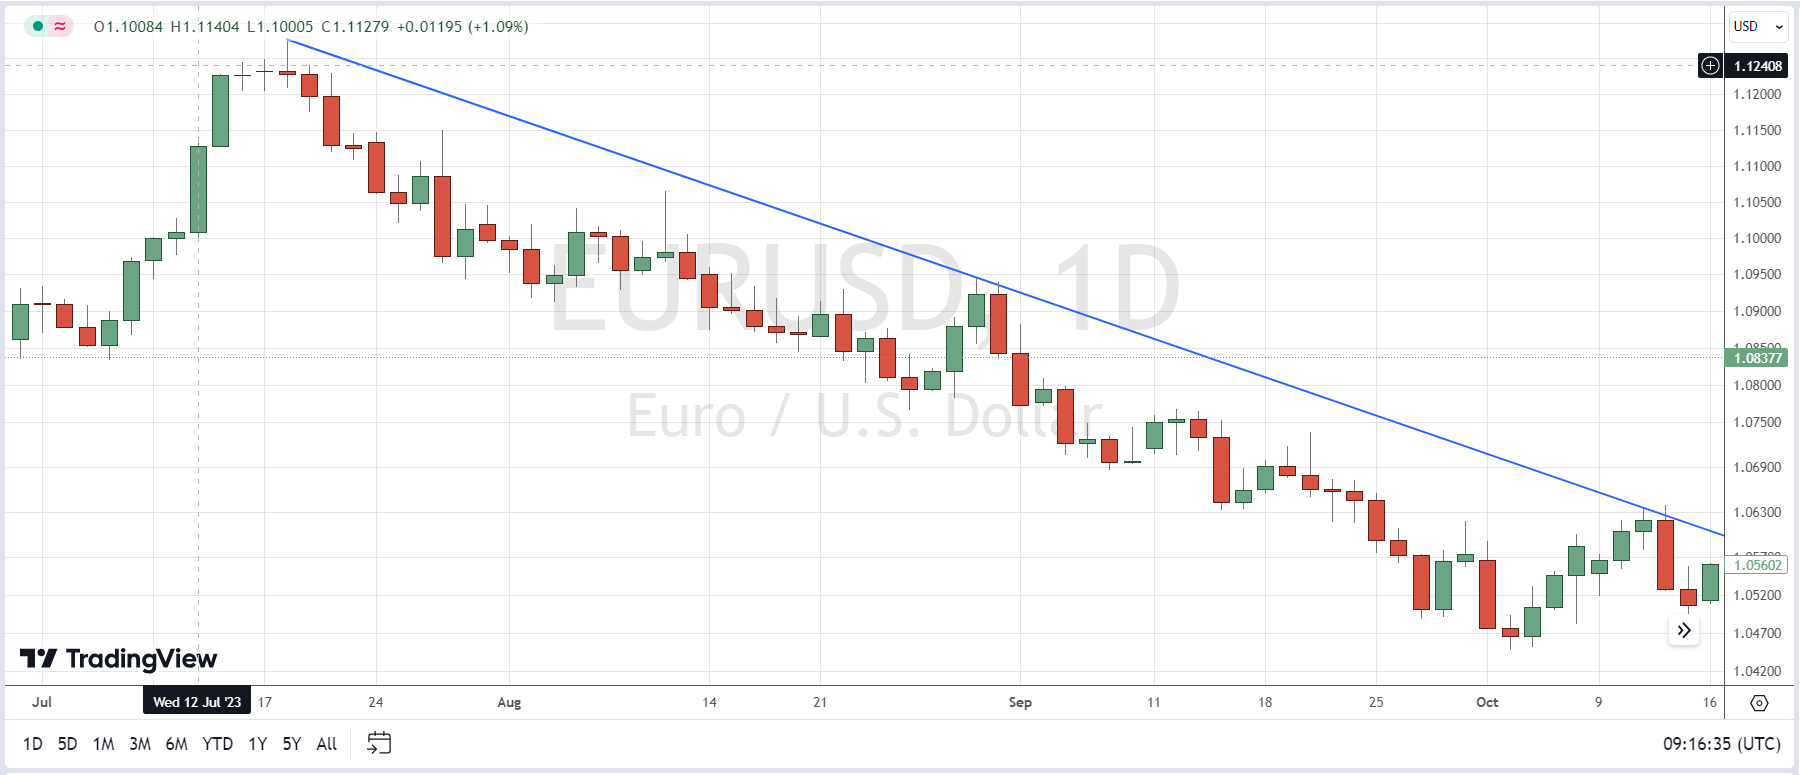
Downtrend lines act as resistance levels, signifying an excess of supply compared to demand, even as prices decrease. As long as prices remain below the trend line, the downtrend is seen as sustained. A breach above the downtrend line signals a potential trend reversal.
Channels
Once you learn to identify trend lines, you can apply them to analyze trend channels. Channels are in fact two parallel lines, with a market’s price action bouncing between them. If the market’s price action remains between these two lines, then you can trade the channel by selling at the top and buying at the bottom.
Volume
Volume is a useful tool to look at when identifying trends. It tells you how much the asset has been traded in any given session, and can offer insight into how strong a move is. If a market is trading on the upside but there is barely any buying volume, it is likely that there will not be enough momentum to continue for much longer.
Indicators
Trend Indicators can also be a useful tool for a trend trader in trading with the trend. A popular indicator used by traders is the moving average. This gives you an average of a market’s price movements over a given period and can tell you when it is about to enter a new trend. The Relative Strength Index (RSI), on the other hand, is often used to measure the strength of ongoing moves.
Indicators and patterns can both be useful when looking for trading opportunities. Accurately identifying a trend is a crucial step in trading.
Technical analysis offers a myriad of tools and techniques that traders must consider carefully before making actual trades, however none of them is foolproof.
For further reading you can visit our FPT Trading Academy.