The average true range (ATR) indicator is a widely-used tool among technical traders (including in Prop Trading) for identifying market volatility swiftly. Here’s a closer look at how it functions and its practical applications.
What is Average True Range?
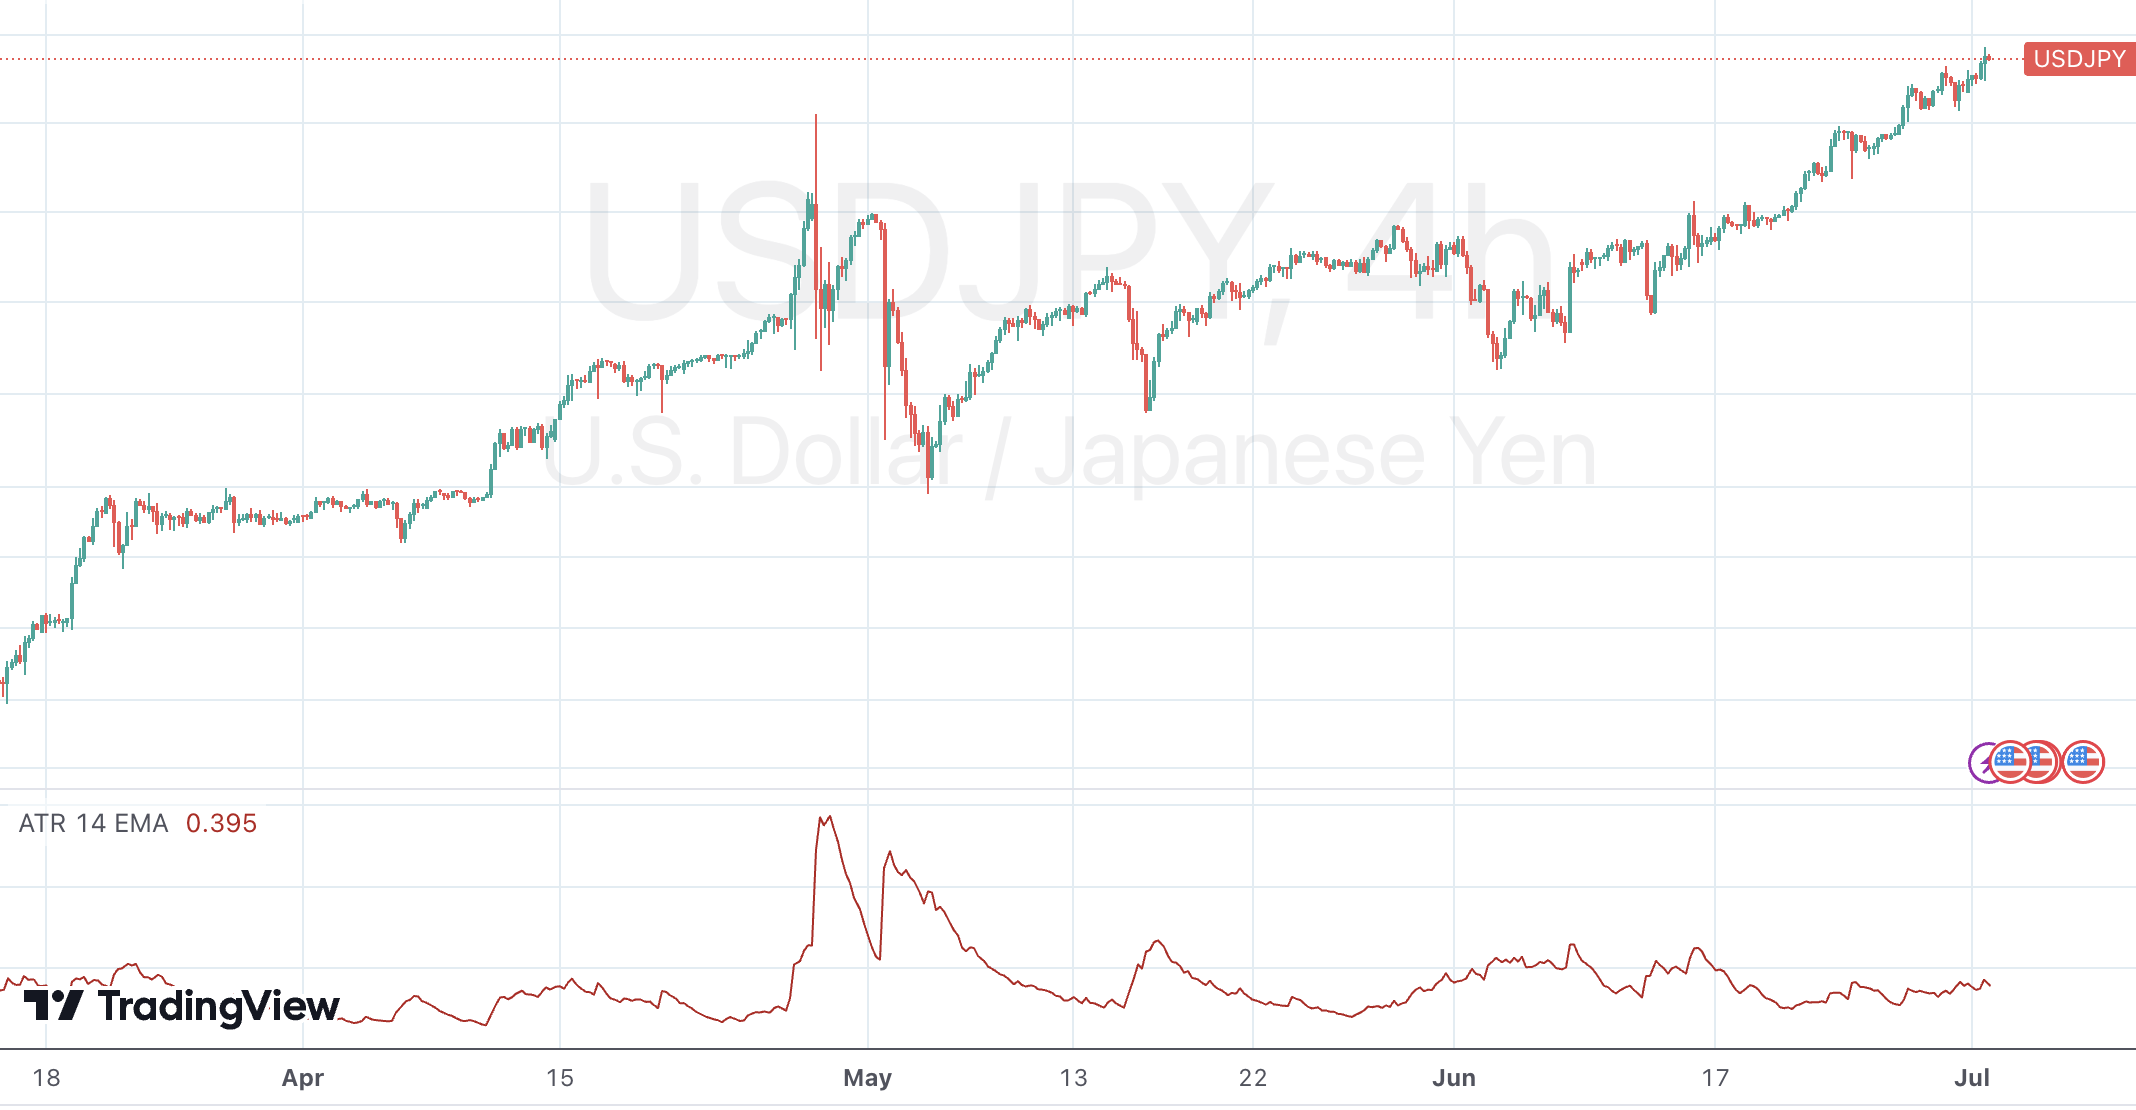
The average true range (ATR) is a technical indicator that displays as a single line within a box beneath a instrument‘s price chart. When this line goes upward, it indicates increasing market volatility, and when it goes downward, it signifies decreasing volatility.
For example, in this USD/JPY chart, the ATR remains below 0.60 when the pair experiences relatively minor price movements. However, as the USD fell against JPY at the end of April and beginning of May, the ATR reached new highs of 1.44, reflecting the surge in volatility.
Originally developed for commodities trading, ATR is now utilized across various asset classes by traders.
Calculating ATR
ATR is essentially a moving average of a market’s true range. To determine the true range, you need to consider three figures:
- The current market high minus its current low;
- The current high minus the previous close;
- The current low minus the previous close.
The true range is the greatest value among these three figures.
For instance, if USD/JPY reaches a high of 113.73 and a low of 113.32 in today’s session, after previously closing at 113.98, the calculations would be:
- 113.73 – 113.32 = 0.41
- 113.73 – 113.98 = -0.25
- 113.32 – 113.98 = -0.66
The true range is the highest absolute value, which in this case is 0.41.
Typically, the ATR indicator takes the true range from the last 14 sessions and converts it into a moving average, represented as a line on the chart. However, traders can adjust the number of sessions to suit their strategies, with short-term traders often using ten sessions or fewer.
Trading with ATR
As a volatility measure, ATR is invaluable for evaluating trading opportunities and determining optimal points for stops and limits. Depending on trader’ preferences, the ATR can be plotted either as a simple moving average (SMA) which simply aggregates data points, or by deciding to give more weight to more recent prices, by applying exponential moving average (EMA), weighted moving average (WMA) or even running moving average (RMA).
ATR is quite useful to quickly gauge the typical daily movement of a market and can assist in deciding whether to act on a signal from another indicator. For example, if ATR shows that a market usually moves 20 points in a day and you identify a sell opportunity after the market has already dropped 25 points, it may be wise to reconsider the trade.
Setting Stops and Limits
ATR also aids in setting realistic profit targets and stop losses. If a market typically moves 20 points daily, targeting a 50-point profit might be too optimistic. Likewise, for stop losses, if the market is more volatile than usual, placing your stop further from the current price can prevent premature closures, though it does increase overall risk.
ATR Overview
- Type: Indicator
- Used in: Any market conditions
- Purpose: Measuring volatility and evaluating trading opportunities
- Applicable Markets: Any
- Timeframes: Any
In conclusion, the ATR indicator is a versatile tool in technical analysis, providing crucial insights into market volatility and helping traders make informed decisions about entering and exiting trades. By understanding and applying ATR, traders can enhance their ability to navigate the dynamic world of financial markets.
For further reading you can visit our FPT Trading Academy.